[Drawing Method] Screen
This screen is displayed by clicking [Drawing Method] on the [Accounting Settings] screen.
It enables you to configure the key and layout method for accounting.
The information displayed on the screen differs according to the display type selected in [Display Type] on the [Display Type] screen. After configuring the settings, click [Start] to display a table or graph reflecting the settings.
If you selected [Table] in [Display Type]
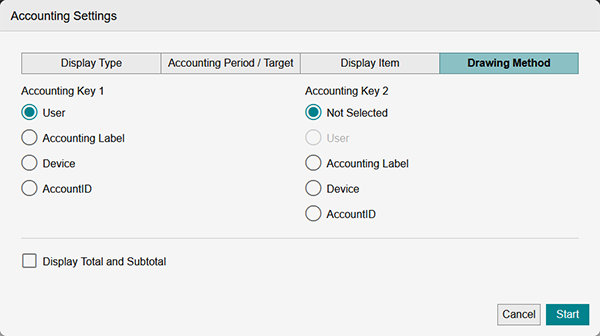
[Accounting Key 1]
Select the first key (the first column) of the table.
[Accounting Key 2]
Select the second key (the second column) of the table.
- You cannot select the same value as [Accounting Key 1].
[Sort by Day]
Select whether to sort days vertically or horizontally. Select vertical for a table that makes it easier to confirm the daily transition or horizontal for a table that makes it easier to compare each accounting key for a specific time of the day.
- This is only displayed when [Device Running Time Accounting (Seconds)] is selected in [Accounting Data Type].
[Display Total and Subtotal]
Select this to display the total and subtotal at the end of the table.
[Combine Monthly Accounting Results]
Select whether to display the accounting results as monthly columns or to display the total value for the selected month in one column.
- This is only displayed when [Monthly Accounting (Use Daily Data)] or [Monthly Accounting (Use Closing Data)] is selected in [Accounting Data Type].
- In this example, [Accounting Label] is selected in [Accounting Key1] and [User] is selected in [Accounting Key 2].
For daily accounting
| Accounting Label 1 | User ID | By Service | By Output Color | Total Sheets | |||
|---|---|---|---|---|---|---|---|
| Copy | Total B&W Impressions | Total Color Impressions | |||||
| Black & White Copy Impressions | Color Copy Impressions | Black & White Print Impressions | |||||
| Personnel Department | user1 | 10 | 10 | 10 | 10 | 10 | 50 |
| Personnel Department | user1 | 5 | 15 | 0 | 5 | 15 | 40 |
| Sales Department | user2 | 5 | 0 | 0 | 0 | 0 | 5 |
| Sales Department | user2 | 5 | 0 | 0 | 0 | 0 | 5 |
For monthly accounting
| Accounting Label 1 | User ID | 2021-04 | 2021-05 | ||||||||
|---|---|---|---|---|---|---|---|---|---|---|---|
| By Service | By Output Color | Total Sheets | By Service | By Output Color | Total Sheets | ||||||
| Copy | Total B&W Impressions | Total Color Impressions | Copy | Total B&W Impressions | Total Color Impressions | ||||||
| Black & White Copy Impressions | Black & White Print Impressions | Black & White Copy Impressions | Black & White Print Impressions | ||||||||
| Personnel Department | user1 | 10 | 10 | 10 | 10 | 40 | |||||
| Personnel Department | user1 | 5 | 0 | 5 | 15 | 25 | |||||
| Sales Department | user2 | 5 | 0 | 0 | 0 | 5 | |||||
| Sales Department | user2 | 5 | 0 | 0 | 0 | 5 | |||||
If you selected [Column Chart] or [Bar Chart] in [Display Type]
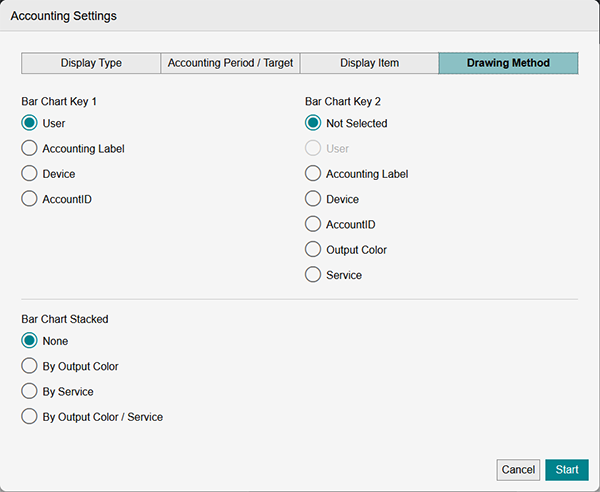
[Bar Chart Key 1]
Select the first key of the bar chart.
[Bar Chart Key 2]
Select the second key of the bar chart.
- You cannot select the same value as [Bar Chart Key 1].
[Bar Chart Stacked]
Select whether to total the display items or stack the results of accounting by the specified key in the bar chart. If you selected [Off], drawing is performed with the total value.
- You cannot select the same value as [Bar Chart Key 2].
If bar chart stacking is specified, the chart is displayed with different colors for each specified key.
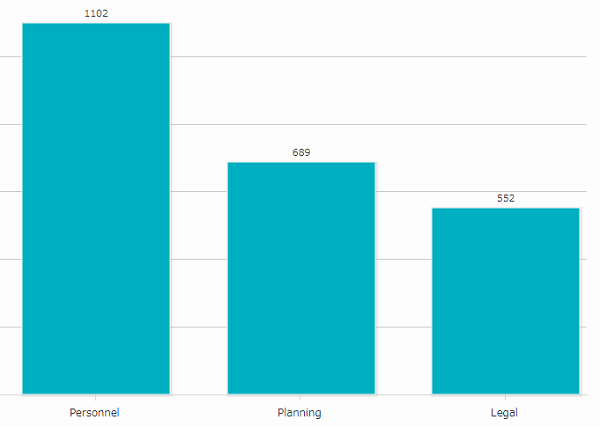
When not stacking
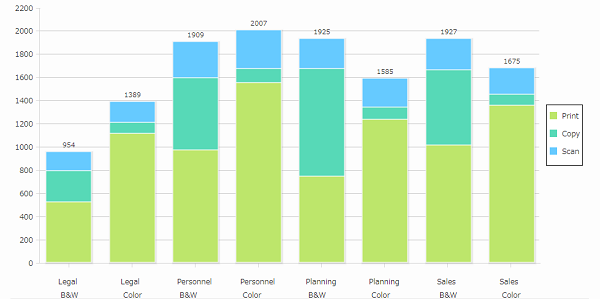
When stacking
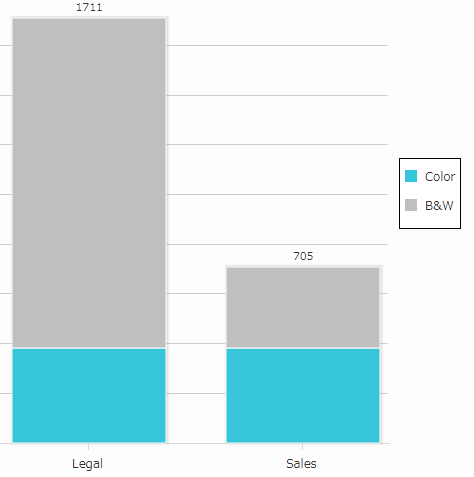
In this example, [Accounting Label] is selected for [Bar Chart Key 1], [Output Color] for [Bar Chart Key 2], and [By Service] for [Bar Chart Stacked].
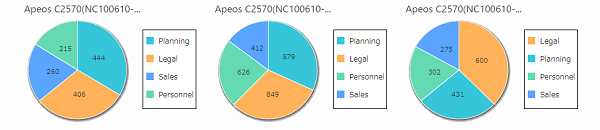
If you selected [Pie Chart] in [Display Type]
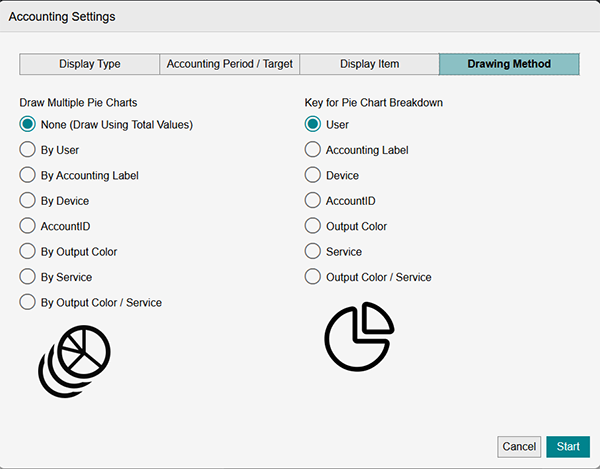
[Draw Multiple Pie Charts]
Specifies whether to draw one pie chart or multiple pie charts. When drawing one pie chart, the display items are displayed as totals. When drawing multiple pie charts, select the key for accounting.
[Key for Pie Chart Breakdown]
Specifies the key for pie chart breakdown.
- You cannot select the same value as [Draw Multiple Pie Charts].
In this example, [By Service] is selected in [Draw Multiple Pie Charts] and [Accounting Label] in [Key for Pie Chart Breakdown].
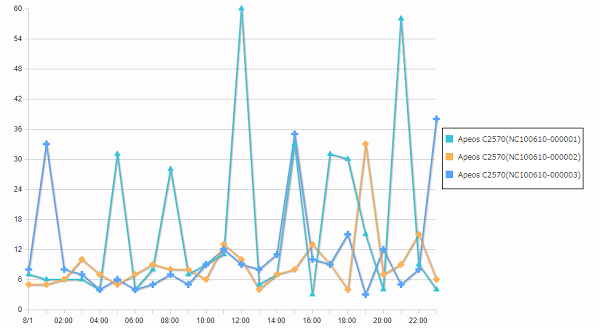
If you selected [Line Chart] or [Area Chart] in [Display Type]
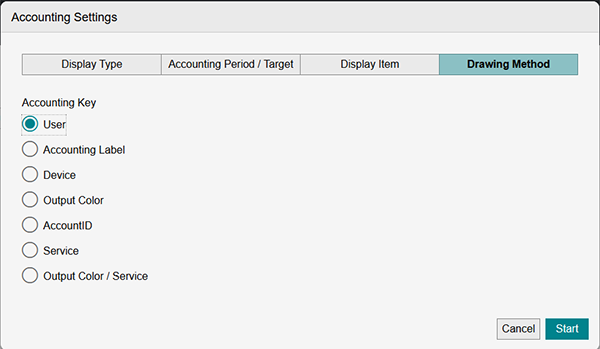
[Accounting Key]
Select the key of the chart.
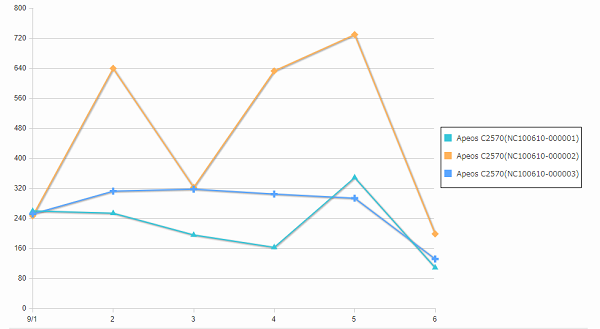
In this example, [Device] is selected in [Accounting Key] for a line chart.
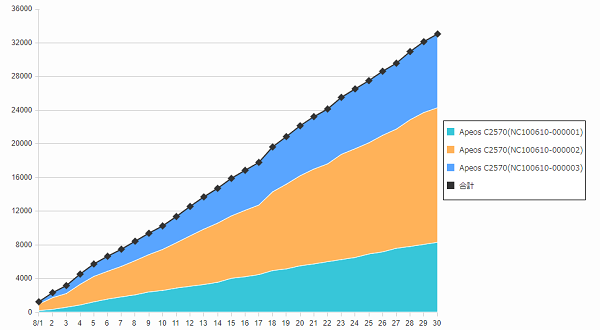
In this example, [Device] is selected in [Accounting Key] for an area chart.
In this example, [Device Running Time Accounting (Seconds)] is selected in [Accounting Data Type] for a line chart.